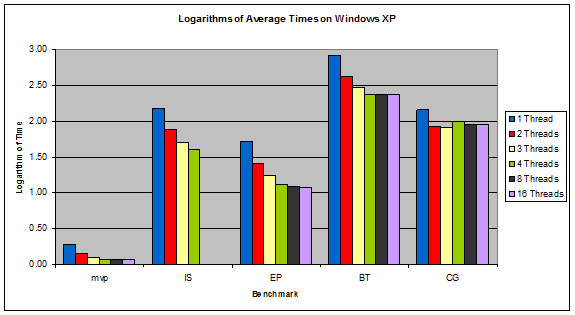
 Figure 3: Logarithms of Average Times on Windows XP
2009 Science Fair project by Michael Craft.
Download PDF
Download Experimental Data XLS
Download Source Code
Until recently, personal computers have had a single processor. Now, with multi-core processors quickly becoming the new standard, programs need to be written to take advantage of this new technology. The purpose of this project was to investigate the impact of the operating system on the execution of parallel code and determine which operating systems allow parallel code to operate most efficiently.
My hypothesis was that Gentoo Linux would perform the best for two reasons. First, the Linux kernel is lightweight and well written, and second, the Gentoo operating system is completely compiled from source and tailored to the specific process architecture upon which it is installed.
In my experiments I ran five parallel benchmarks on Windows XP, Gentoo Linux, Debian Linux, and FreeBSD on a computer with an Intel quad core processor, and used a Python script to time them. The results were then put into Microsoft Excel and analyzed.
The results showed that the Linux systems were equally efficient at executing parallel code and had the overall lowest execution times, confirming my hypothesis. The results from this project show that Linux is best suited to lead the way in the new era of parallel computing. Other interesting results were that while Windows XP had the slowest overall execution times, it had the best speedup ratios, suggesting that it does a better job at multi-threading. And even though Gentoo is specifically compiled for the processor architecture of the system it is installed on, and Debian is a generic pre-compiled system, they performed nearly identically.
Table of Contents
List of Figures
Until recently, personal computers have had a single processor. Manufacturers have simply been increasing the processors clock speed to make them faster, but recently manufacturers have hit a wall in clock speeds do to cooling problems, and physical constraints.
To solve this problem, and continue the advancement of processors, processors now contain multiple cores, allowing them to run several threads at the same time in parallel. This can lead to a huge increase in speed, but only if programs are written to take advantage of it.
Even if code is written to take full advantage of a parallel processor, the program will only be as good as the operating system it is run on. The goal of my project was to investigate the impact the operating system has on the execution of parallel code and to determine which OS allows parallel code to operate most efficiently. Thus, my work will which OS is best suited to lead the way in the new era of parallel computing.
My hypothesis was that Gentoo Linux would perform the best for two reasons. First, the Linux kernel is lightweight and well written, and second, the Gentoo operating system is completely compiled from source and tailored to the specific process architecture upon which it is installed.[1]
My experiments were run on a computer with an Intel Core 2 Quad Q6600 2.4 GHz processor and an ASUS P5N-D motherboard with an Nvidia nForce 750i chipset.
The operating systems tested were Gentoo Linux with kernel 2.6.26, Debian Linux 5.0 (Lenny) with kernel 2.6.26, PC-BSD 7.0 with kernel FreeBSD 7.1-PRERELEASE, and Microsoft Windows XP SP2 with the Cygwin UNIX compatibility layer.
Four of the benchmarks that were utilized were from the NASA Advanced Supercomputing Parallel Benchmarks[2], and the fifth benchmark was written by me using examples from the book Using OpenMP[3, p.37]. All of the benchmarks make use of the OpenMP framework for making their code parallel. All benchmarks were compiled with GCC 4.3.2, except for the FreeBSD benchmarks, which were compiled with GCC 4.3.3 due to technical constraints. This difference in compiler should not have affected the results because there were no performance-related changes between GCC 4.3.2 and GCC 4.3.3[4].
The specific benchmarks used were:
Each benchmark was intended to be run with 1, 2, 3, 4, 8, and 16 threads, for a total of 30 experiments. Unfortunately, the IS benchmark can only use a maximum number of 4 threads, and the IS benchmark will not run at all in FreeBSD. Thus, only 28 experiments had meaningful results on every OS besides FreeBSD. Of which 24 experiments produced meaningful results, because the IS benchmark would not run in FreeBSD.
Each benchmark was run on each OS (subject to the constraints mentioned in Section 2.3.1), and the execution times were collected by a Python script written by me. Before each set of benchmarks was run, all non-critical processes on the system were killed, except for a process manager to monitor the execution. For Windows this was the "Task Manager" process manager, and for the other systems it was the "top" utility. The Python script ran each benchmark 20 times, using 1, 2, 3, 4, 8, and 16 threads. The script then collected the execution times and put them into a CSV file. The CSV file was then put into Microsoft Excel and used to calculate the average times, logarithmic times, speedup ratios, and standard deviations.
The speedup ratio is the ratio of how much faster each multi-threaded execution was than the initial single threaded execution, and it is used to measure the success of the parallelization. Ideally, the speedup ratio would be equal to the number of processors the program is run on. This can be expressed by the following equation, in which S represents the speedup ratio, T1 represents the execution time on a single processor, and TP represents the execution time on P processors.
S = T1/TP [3, p.33]
Figure 1: Equation for Determining Speedup Ratio
Section 3.1 presents the graphical representation of the raw data, and Section 3.2 presents an analysis of the data.
The numerical raw data collected from the experiments can be downloaded above.
In the following graphs, the acronyms are interpreted in this manner:
| mvp | Matrix-Vector Product |
| IS | Integer Sort |
| EP | Embarrassingly Parallel |
| BT | Block-Tridiagonal |
| CG | Conjugate Gradient |
Figure 2: Table of Acronyms for Benchmarks
The graphs are grouped by operating system, with the logarithmic times first, followed by the speedup ratios.
In the graphs below, the IS benchmark data is incomplete due to its inability to run with more than four threads.
 Figure 3: Logarithms of Average Times on Windows XP
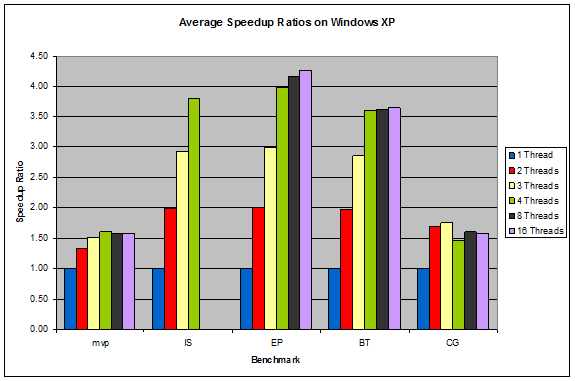 Figure 4: Average Speedup Ratios on Windows XP
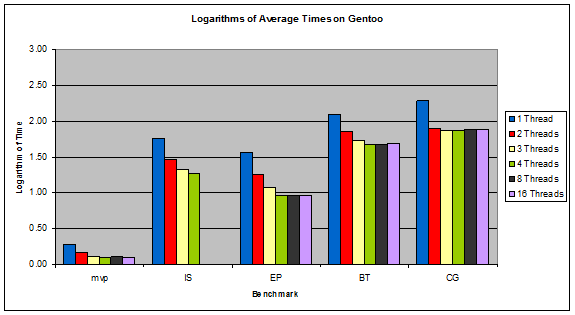 Figure 5: Logarithms of Average Times on Gentoo
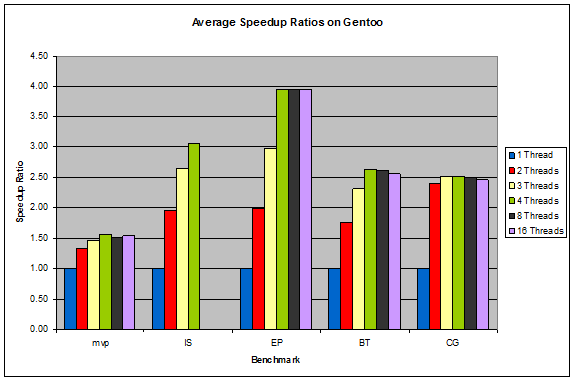 Figure 6: Average Speedup Ratios on Gentoo
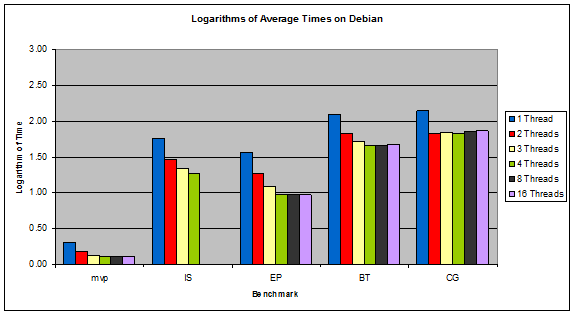 Figure 7: Logarithms of Average Times on Debian
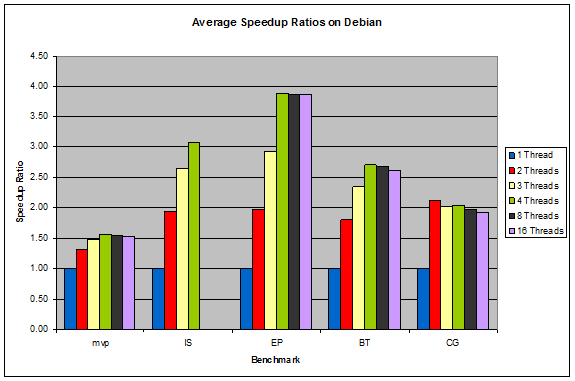 Figure 8: Average Speedup Ratios on Debian
I remind the reader that the IS benchmark would not run under FreeBSD.
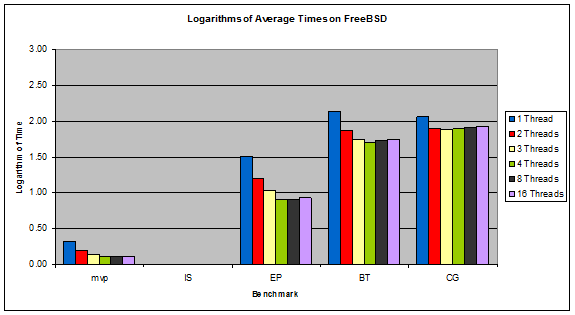 Figure 9: Logarithms of Average Times on FreeBSD
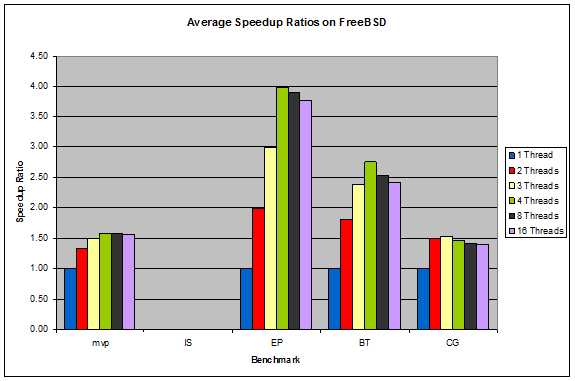 Figure 10: Average Speedup Ratios on FreeBSD
The systems with the overall lowest execution times were the Linux systems, as predicted. What was unexpected was that Gentoo and Debian performed almost identically the same. This is surprising because Gentoo is custom tailored and compiled for the specific system it is installed on, which theoretically should make it faster whereas Debian is a pre-compiled generic system.
Another interesting result is that while Windows XP had the slowest overall execution times, it scaled up the best with increasing number of threads. Many of its benchmarks came very close to their ideal speedup ratios, as seen in Figure 4.
In the Linux systems, the performance of a benchmark more or less peaks after exceeding the number of physical cores on the system (4 in this case), which is to be expected. In Windows, the performance continues to increase slowly after exceeding the number of physical cores. This, along with Windows' superior speedup ratios, suggests that Windows does a very good job at multithreading. FreeBSD is quite the opposite, with its benchmarks' performance dropping noticeably after exceeding the number of physical cores, suggesting that there is a larger overhead associated with running multiple threads in FreeBSD.
Across most operating systems, the CG benchmark behaved very sporadically, as seen in the graphs, and in its somewhat high standard deviations, which are reproduced below.
| 1 Thread | 2 Threads | 3 Threads | 4 Threads | 8 Threads | 16 Threads | |
| Windows XP | 0.16 | 1.11 | 0.84 | 4.28 | 1.44 | 1.41 |
| Gentoo | 19.69 | 3.12 | 2.38 | 1.10 | 1.65 | 1.62 |
| Debian | 0.12 | 0.80 | 0.55 | 0.85 | 0.64 | 0.60 |
| FreeBSD | 0.44 | 2.15 | 1.42 | 0.83 | 0.68 | 1.04 |
Figure 11: Standard Deviations of CG Benchmark in Seconds
These relatively high standard deviations could be due to the benchmark's use of random data.
Based on the results, both Gentoo and Debian Linux allowed the parallel code to operate the fastest, which confirmed my hypothesis that Gentoo Linux would be the fastest.
Future work on the topic could include:
[1] "About Gentoo". Gentoo Foundation. 2/15/09 <http://www.gentoo.org/main/en/about.xml>.
[2] "NAS Parallel Benchmarks". NASA. 2/15/09 <http://www.nas.nasa.gov/Resources/Software/npb.html>.
[4] "GCC 4.3.3 Change Log". Free Software Foundation. 3/7/09 <http://gcc.gnu.org/gcc-4.3/changes.html#4.3.3>.